Peloton, Competition, and Dashboards
I tend to be competitive with most things in my life. This has included playing competitive college tennis, getting to the final table of a World Series of Poker tournament in Las Vegas and, for the past 23 years, running Media Genesis. Whether it’s sports, physical challenges, or business, I love the competition.
When it comes to working out at the gym, spinning is what I enjoy – in an exhausting and dripping sweat kind of way. When riding a more traditional stationary bike, I can set my own goals (i.e. maintain a certain timed pace), but it lacks a motivating factor: competition. Then along came the Peloton Bike. I purchased one a couple of years ago. For me, the big difference in getting a great workout is the Instructor (coach) and the Dashboard (key stats).
How It Works
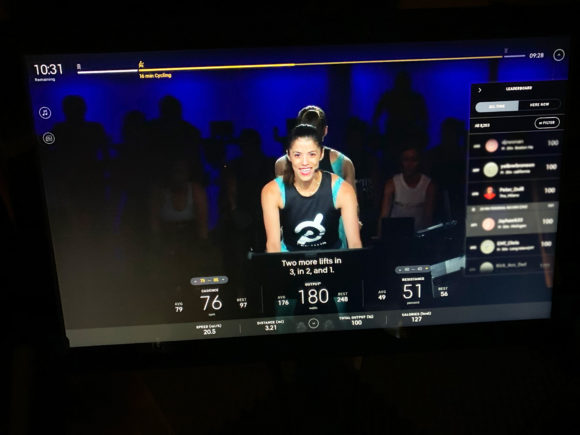
The classes are live-streamed, or you can watch them on-demand. An Instructor helps to motivate and guide you through the class and there is a Leaderboard that shows your real-time ranking against all other riders participating in the class. Even if you do an on-demand class, you can still see how you rank compared to those who took the live class and all of those who have done (or are currently doing) the class on-demand. If you aren’t into the competition, you can always close out the Leaderboard (or other stats) and just ride at your own pace.
The Peloton Bike has an internet-connected video screen mounted in front of the handlebars. The video interface shows the Instructor riding and looking into the camera with a host of stats displayed around the edges of the screen. This Dashboard is where you find your critical stats (i.e. Cadence, Output, Resistance, etc.) and the Leaderboard. The healthy competition and scoreboard are what drive me to do more than I could accomplish on my own.
Competition in Business
In business, it can be difficult to meet and exceed goals entirely on your own, but it should be easier, especially in this connected digital world. After you build a new website, your job is only half finished – the other half is measurement, ongoing optimization, and digital advertising. Media Genesis relies heavily on reviewing past website analytics to know what is working well and what needs improvement when designing a new website.
And the website is only one component of your online presence. You need to factor in social media accounts such as Facebook, LinkedIn, Twitter, Instagram, etc. to keep up with (and ideally surpass) your competition. You also need to be tracking how well your business is doing across these social platforms, national and global rankings, domain authority ranking, and search engine keyword ranking just to name a few.
At Media Genesis, our Managed Services Plans include tracking, benchmarking, reporting, and ongoing refinement. Measuring how our clients’ site/channels and digital advertising are performing compared to their competitors is something we do regularly. We typically do these client reports/reviews on a monthly or quarterly basis. We also provide a Client Dashboard so each client can view key website analytics, all of their social platforms, and real-time spend/performance of the digital advertising campaigns we are managing for them – all in a single, easy-to-navigate space.
This real-time Dashboard provides:
- Insights on your users and how they utilize your website
- Metrics associated with your websites’ ROI
- Visualization of your sales funnel
- A/B testing results that allow you to make informed decisions
One challenge with digital is that there is so much data that can be tracked and analyzed, it often results in nothing being reviewed or leveraged to benefit your business. What you need is an Executive Dashboard to highlight key stats and reports/reviews on a regular basis to ensure your business is staying healthy and fit. Let Media Genesis be your coach and keep you on the right track, making needed adjustments to blow past your competition. We can be reached at inquiry@mediaG.com or by phone at 248-687-7888.

.png)